


Road Safety Hotspots
As a safety and driver assistance innovation leader, Mercedes-Benz lives its “Vision 0”. Using data from ADAS sensors in the customer fleet, we identify and analyze critical safety hotspots in the road network.
Be one-step ahead of accidents and turn from reactive to proactive planning
Cities worldwide are striving for Vision Zero to eliminate all traffic fatalities and severe injuries, while increasing safe, healthy, equitable mobility for all. Still, too many people are killed or seriously injured in traffic. Cities have bold targets and we want to be part of the solution.
For Mercedes‑Benz, as an innovation leader in the field of safety and driver assistance systems, the 'Vision of accident-free driving' is part of the company's DNA. Mercedes‑Benz has been a pioneer in safety and assistance systems for decades and our vehicles have a multitude of sensors and assistance systems that make roads safer. We are going one step further to leverage the data from the Mercedes‑Benz assistance systems to identify, analyze and display critical safety hotspots in your street network helping you to take the right actions. Based on high quality data from our ADAS sensors in the customer fleet, we generate a risk model that indicates safety critical situations and near-misses in traffic.
Get in touch with us!
Speak with our experts to explore Road Safety Hotspots and get the answers you need.
Contact usWhat data and features does this product offer?
-
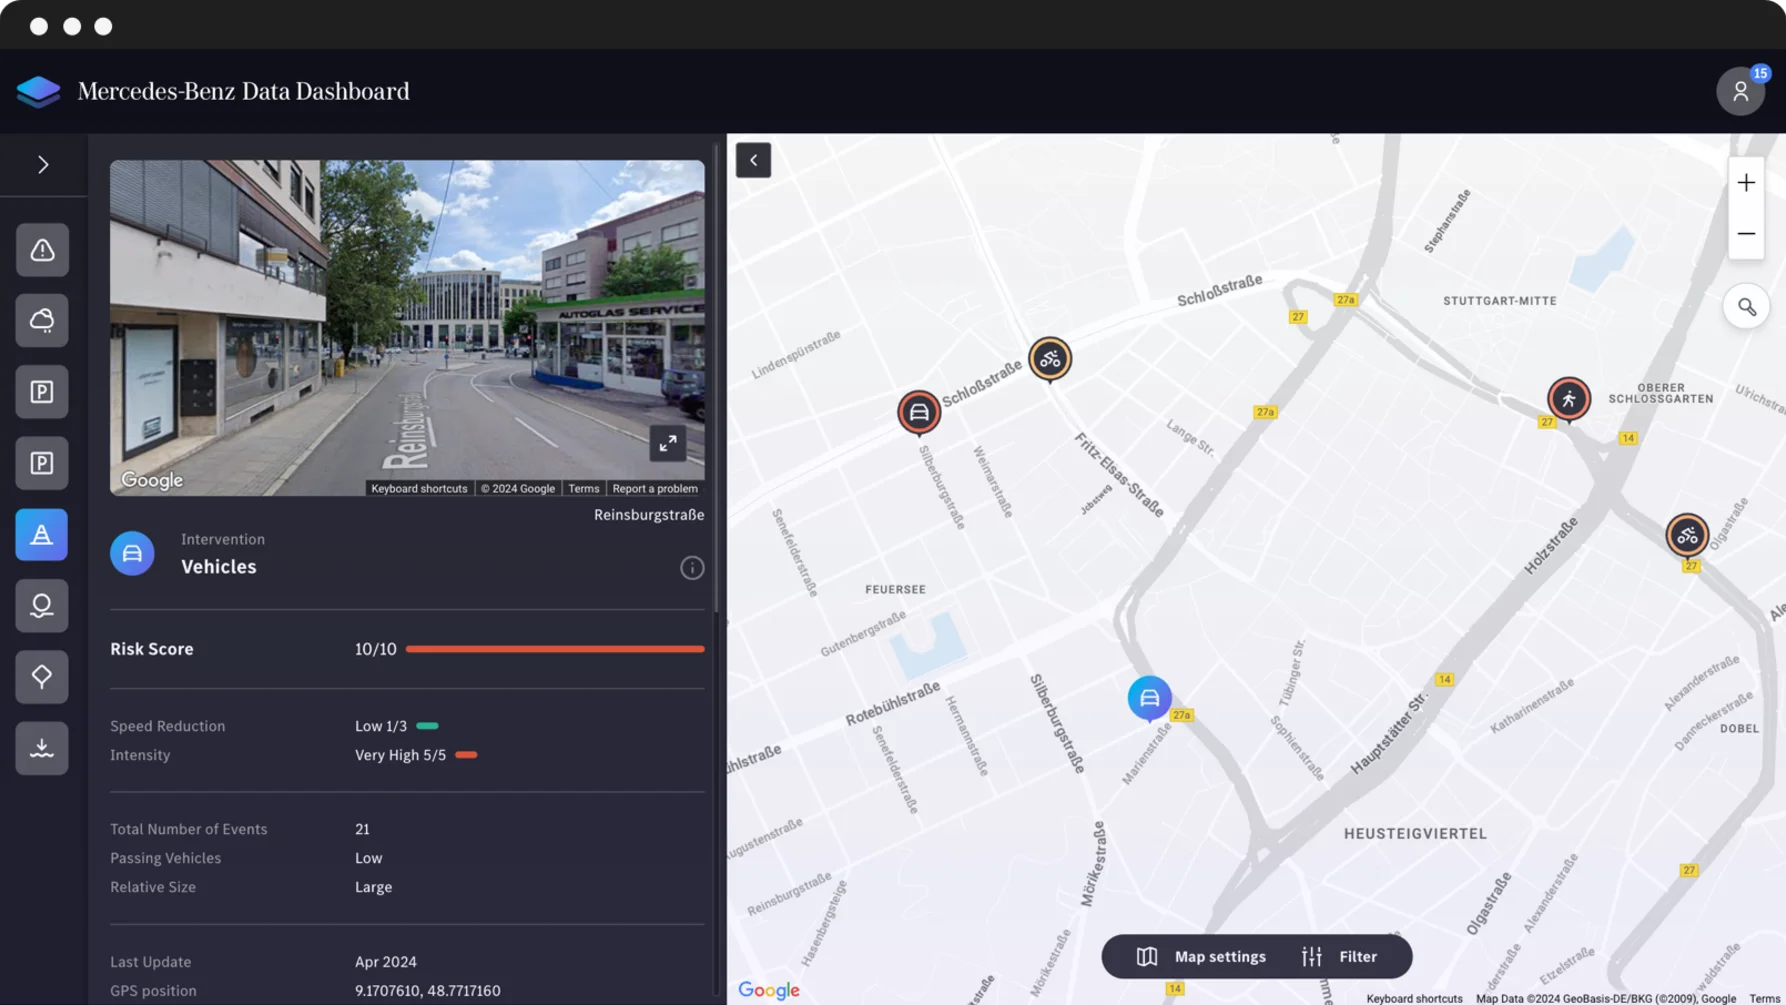
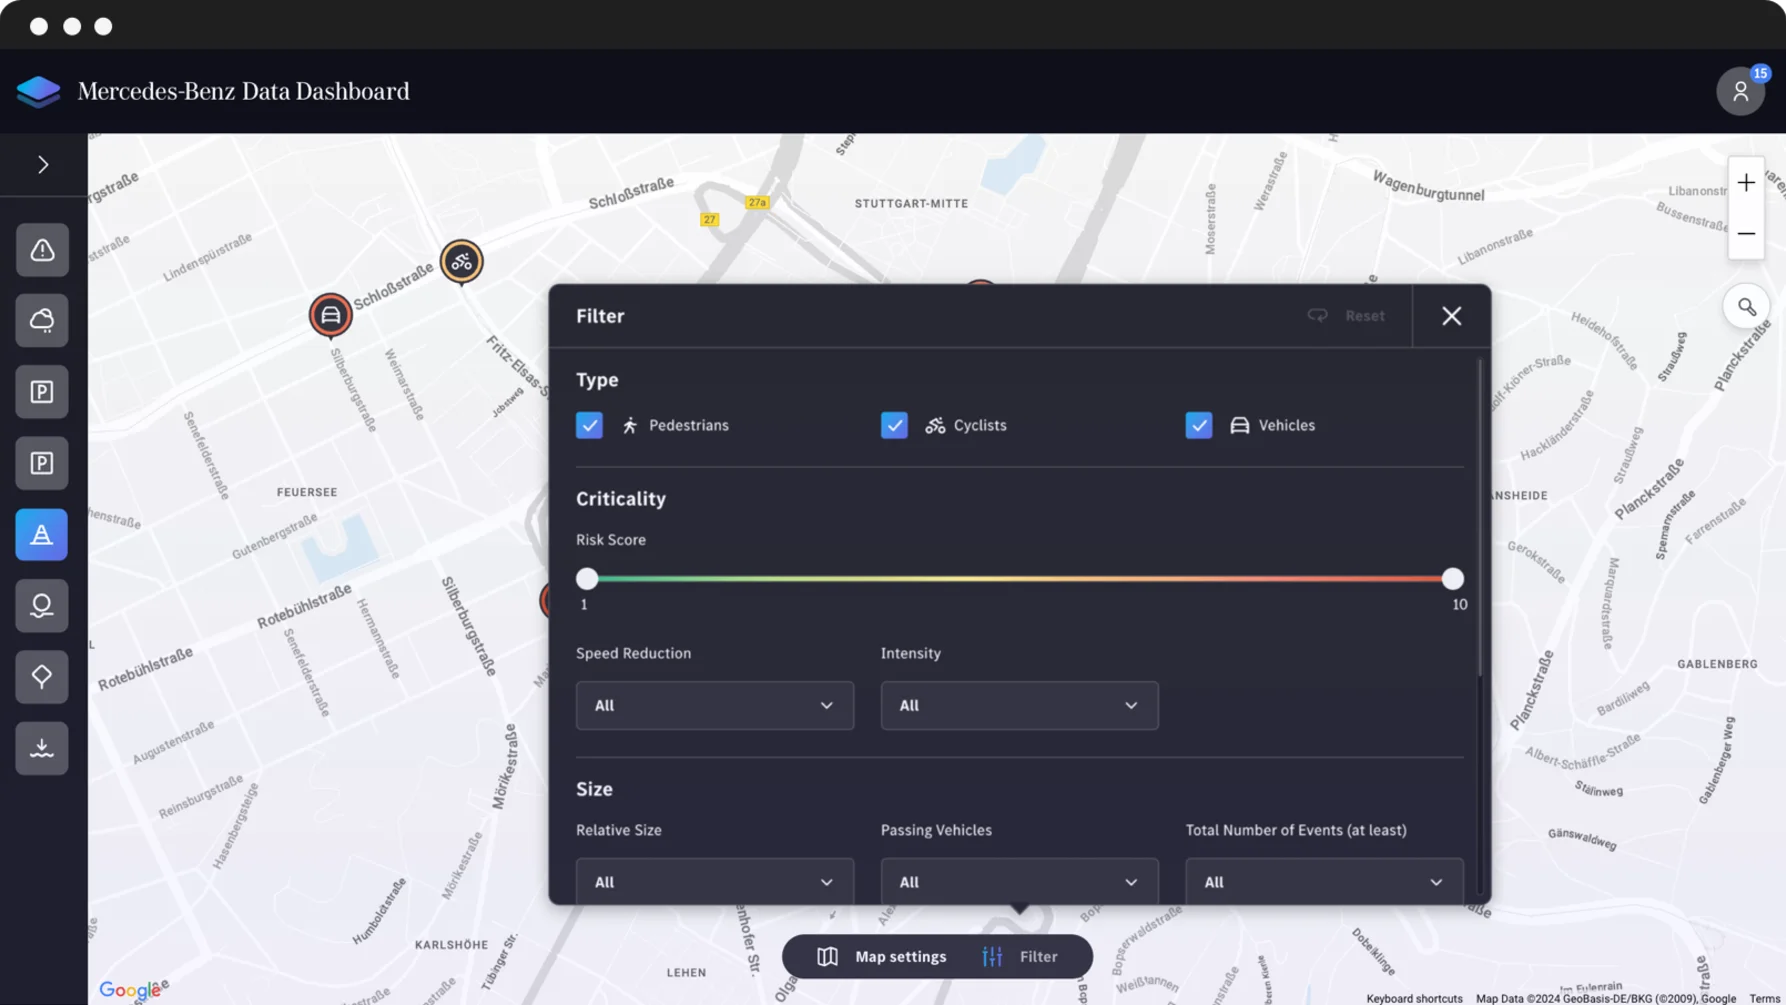
Type of object
-
GPS Position
-
Driving Direction
-
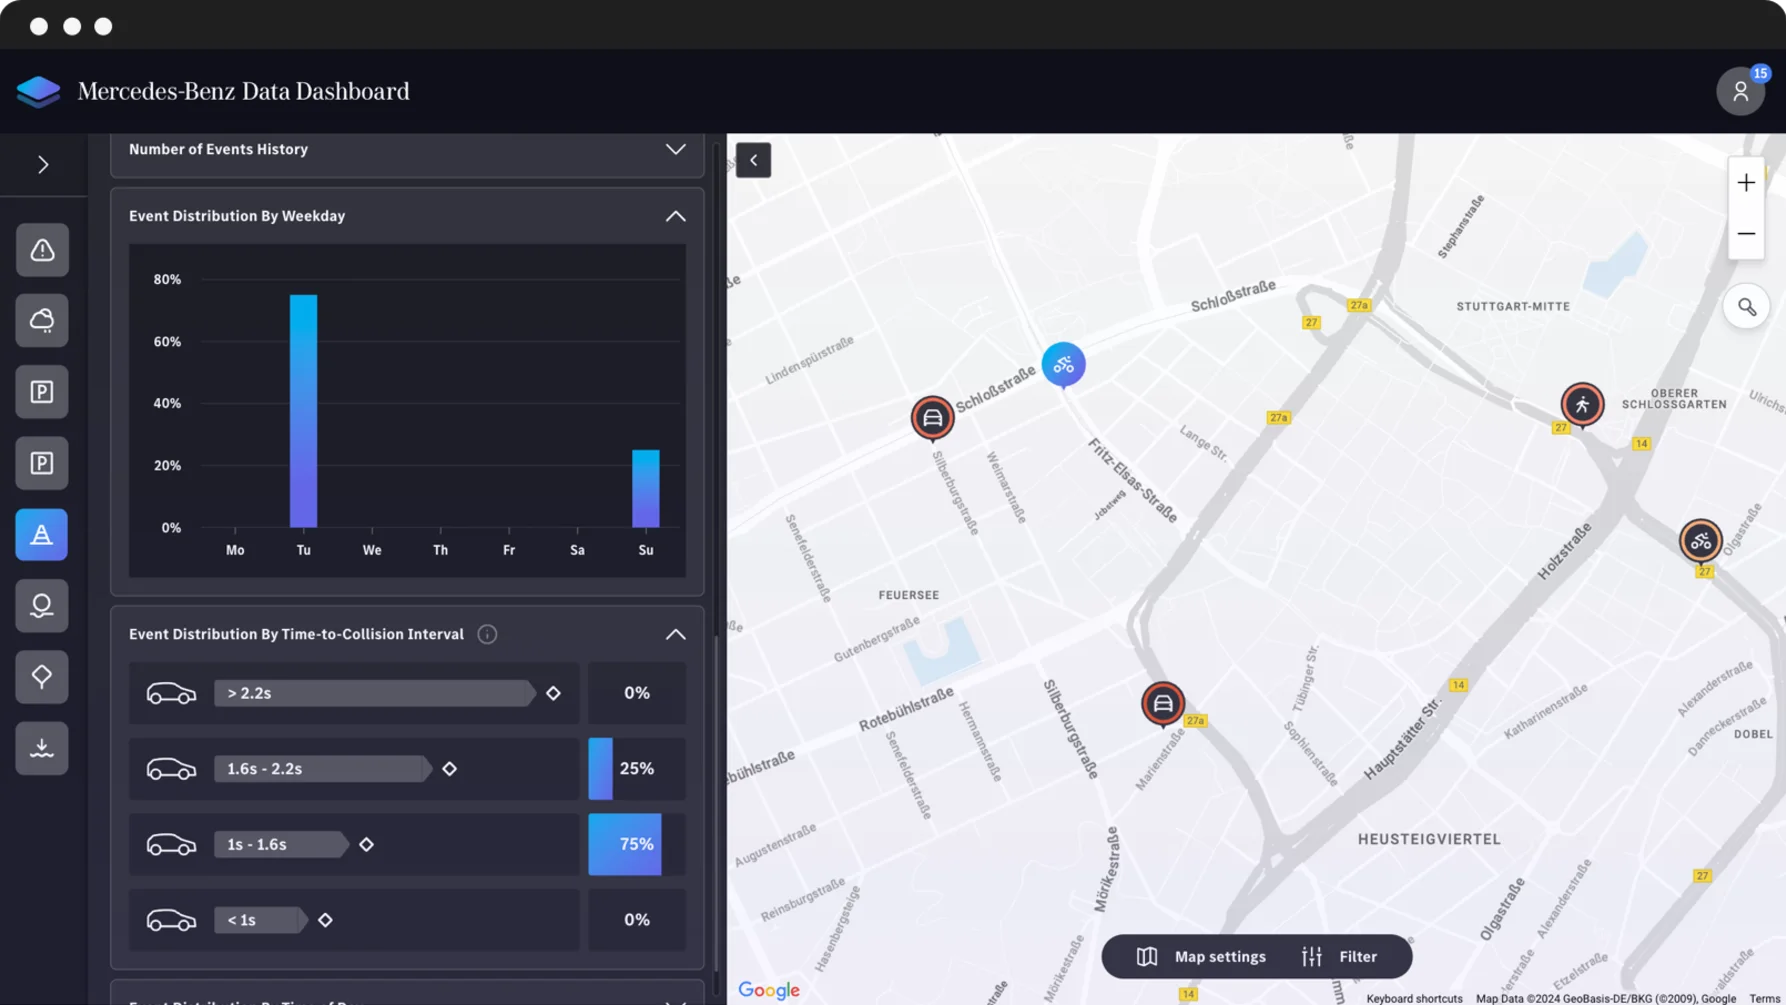
Distribution over Weekdays
-
Distribution over Daytime
-
Distribution over estimated time to collision
-
Event intensity
-
Risk Score
-
Object position in GeoJSON format
-
Road type
-
Near infrastructure
-
Total number of events
-
Number of passing vehicles
-
Speed reduction
Your advantages at a glance
High-quality data insights from Mercedes‑Benz ADAS systems
Our data product identifies, displays and analyzes critical safety hotspots in your street network helping to take the right actions.
-
Create transparency
Get a detailed overview of the riskiest road safety hotspots in your region. For making the right decisions.
-
From data to insights
Compare detailed current information (e.g. hazard description, pedestrians or cyclists involved, accumulations) with historical accidents.
-
Near-accidents included
Gain unique insights into near misses that are not captured with conventional data. This means that future accidents can be avoided before they happen.
-
Valid performance measurement
Identify and measure the success of your efforts to improve road safety and quality using the latest data.
-
Open technology
Integrate different Mercedes‑Benz Data products into your system using plug-in technology - even beyond road safety.
-
Simplified budget allocation
Prioritize the most urgent safety measures and benefit from a more efficient use of public safety budgets.
-
Reports and analysis
Benefit from historical analyses, quarterly road safety reports and detailed analyses of your regional hazard hotspots.
Functions and features of the Road Safety Product
1. Data Collection
Mercedes‑Benz vehicles are equipped with a high range of Advanced Driver Assistance Systems (ADAS) which support the driver and make the streets safer. Whenever an incident is detected by our vehicle assistance systems a full report describing the situation is send to our backend.
2. Analysis
Our Mercedes‑Benz Road Safety Algorithm uses the swarm intelligence of the fleet and detects safety relevant hotspots by searching for signals of the same type accumulating at the same GPS position.
3. Risk Model
The detected hotspots are evaluated based on a risk model taking various metrics (e.g. intensity of intervention, duration of warning, infrastructure characteristics etc.) and additional data sources (e.g. historical crash data) into consideration.
4. True guidance & measurement of mitigations
Identify and display critical safety hotspots in your city where mitigation measures are required before a crash has happened to be one-step ahead. Being able to track mitigations over time by seeing data and incidents decreasing after implementation.
United in “Vision Zero”: collaboration for safer London streets
Transport for London collaborates on the "Vision Zero" initiative, leveraging Mercedes‑Benz vehicle data to decrease traffic incidents and enhance safety for both residents and visitors in London.
Arrange your personal consultation!
Our connectivity specialists will advise you on potential use cases and help you explore how Road Safety Hotspots can support your business or solution.